your project.
Making health data easy to get
One
strategy sprint
with the client to define target group and scope of function
Two
UX sprints
for the entire app design for iOS and Android
Faster adaption of app services
through an understandable approach to tone and design

Design Lead
UX / UI Designers
Illustrator
About the project
Founded as a spin-off of ETH Zurich, Quantactions has developed an algorithm that analyses various health parameters based on smartphone usage.
In collaboration with the client, we analysed the direction of the business model and defined target groups in a strategy sprint. Based on the objectives, we designed an easy-to-use app for iOS and Android that transforms abstract data into clearly understandable health indicators and provides users with additional information and tips for their behaviour.
Brain health app for employees –
paid by their employer

Addressing privacy
and data protection concerns
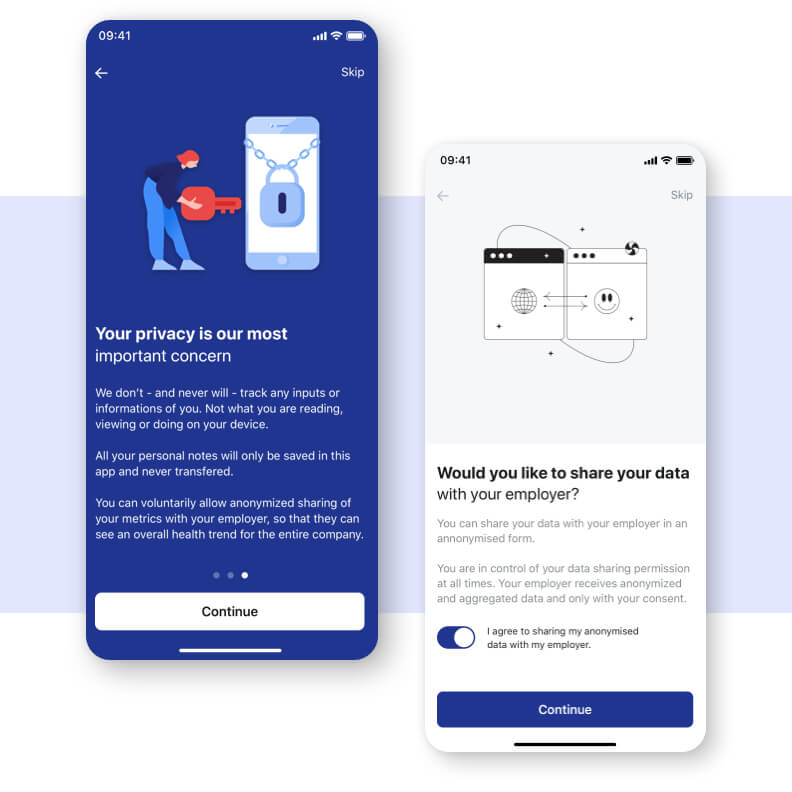
Based on insight from our user interviews privacy concerns was one of the most pressing topics for user - especially in the context of an employer health app. What would be shared with whom?
We used the onboarding process as an excellent opportunity to address these concerns upfront and explain the details of data anonymization, data sharing, and settings options to users.
Smart dashboard —
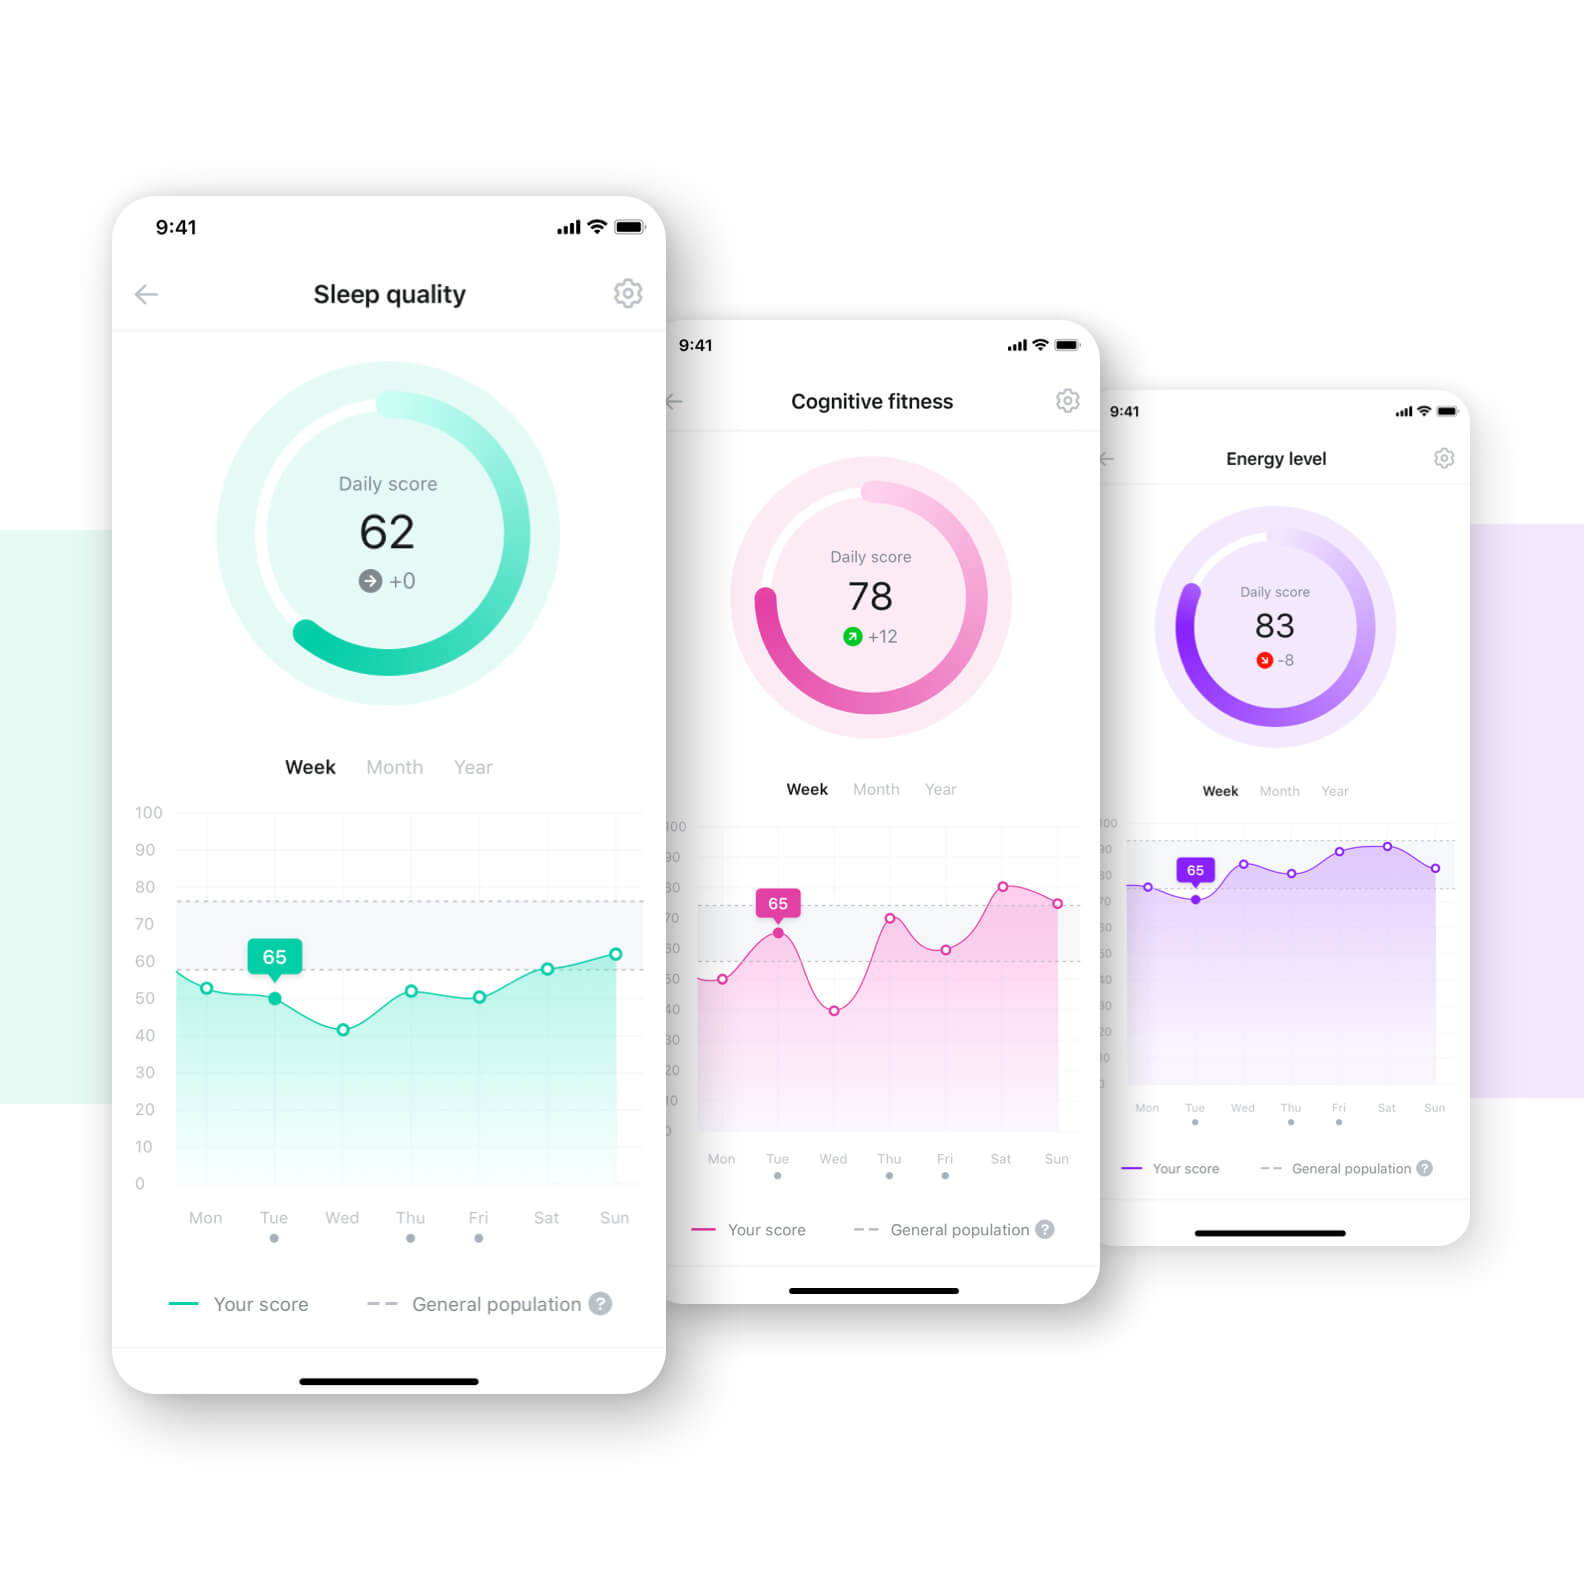
What are the metrics?
The app track factors that impact brain health and thus critical work-life issues such as stress, fatigue, and sleep problems. Based on our Strategy Sprint we established a main objective for the app: to empower users with understandable data. The metrics dashboard and detail pages highlights the impact of the users everyday behaviour and offer guidance on how to interpret the results and proactive steps they can take to improve their health.


What happened today?
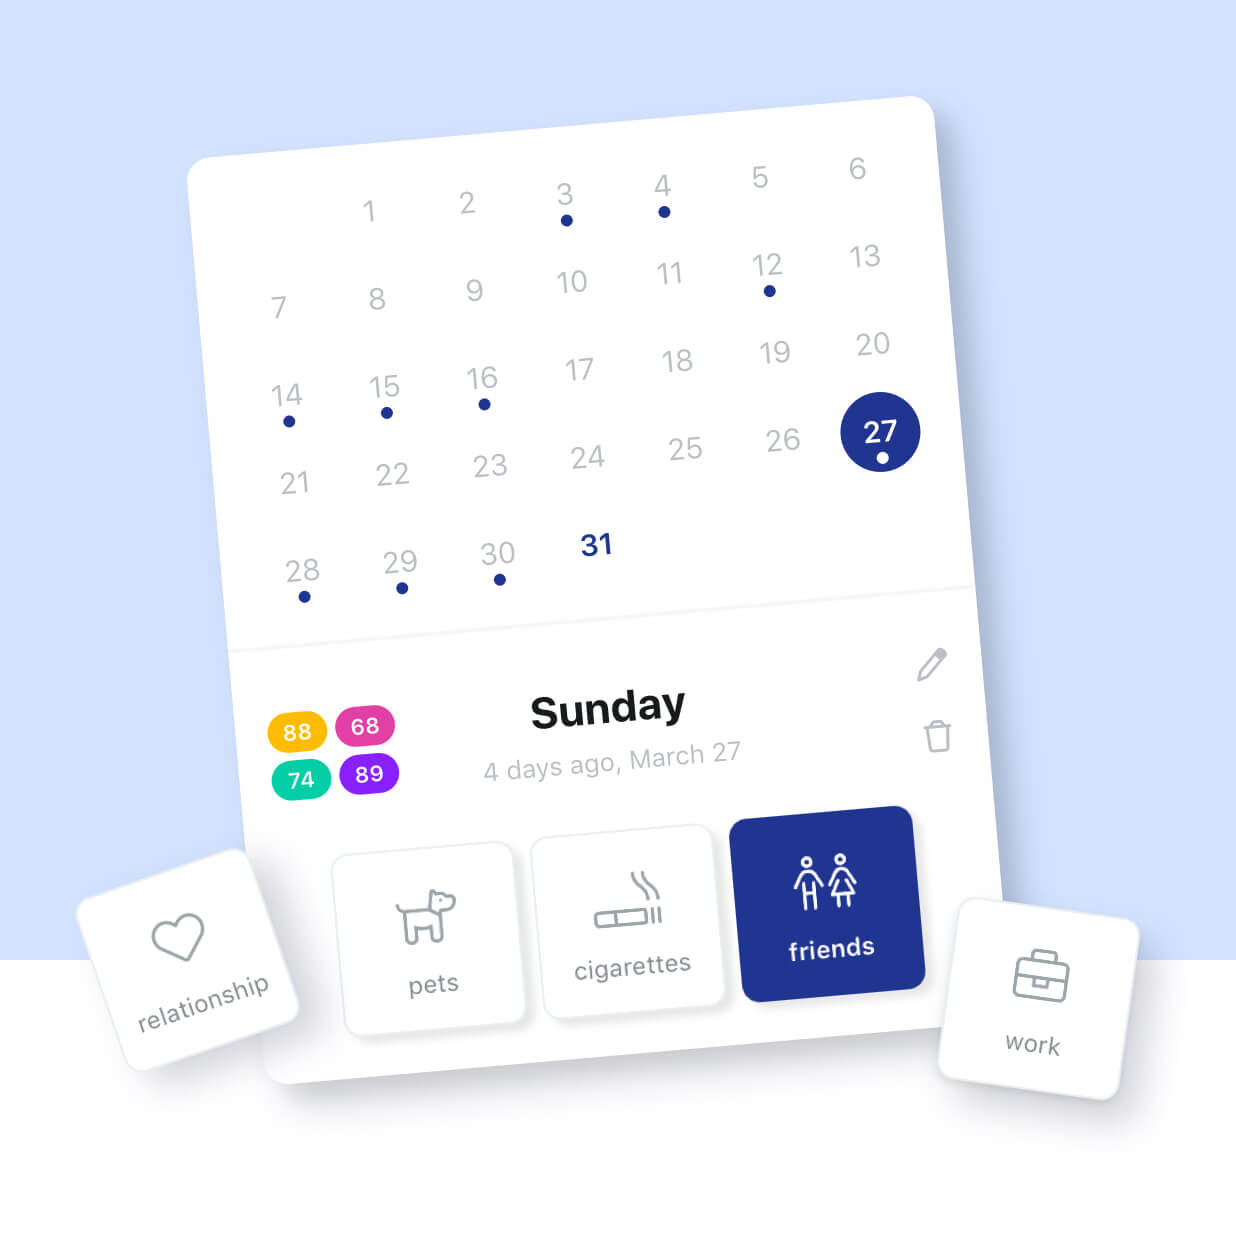
Put it in your daily journal
Studies have shown that humans need context to relate metrics to their everyday behavior and see a connection between trends and their past activities.
Therefore we developed an easy to use journaling functionality to put all scores and trends into perspective by accounting for common influences (e.g. exercise, holiday, social circumstances, etc.) Each event can be rated and described in detail and assist or motivate the user in identifying and resolving potential culprits.
Interactive trend overview —
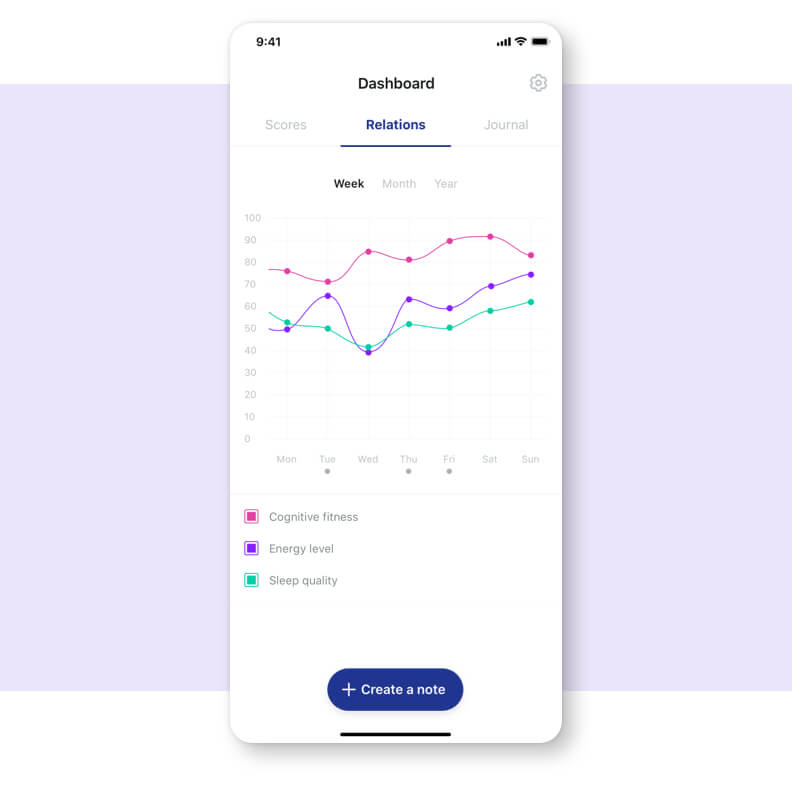
How the metrics influence each other
If the visualization and explanation of single metrics is a first empowerment for the user, the comparison of these metrics offers users wide insights for potential causalities in their personal or professional life. As the app continues to develop and track more metrics, the comparison view can be filtered to focus on the most important parameters.


your project.
